Numbers Annual Report Slider Template
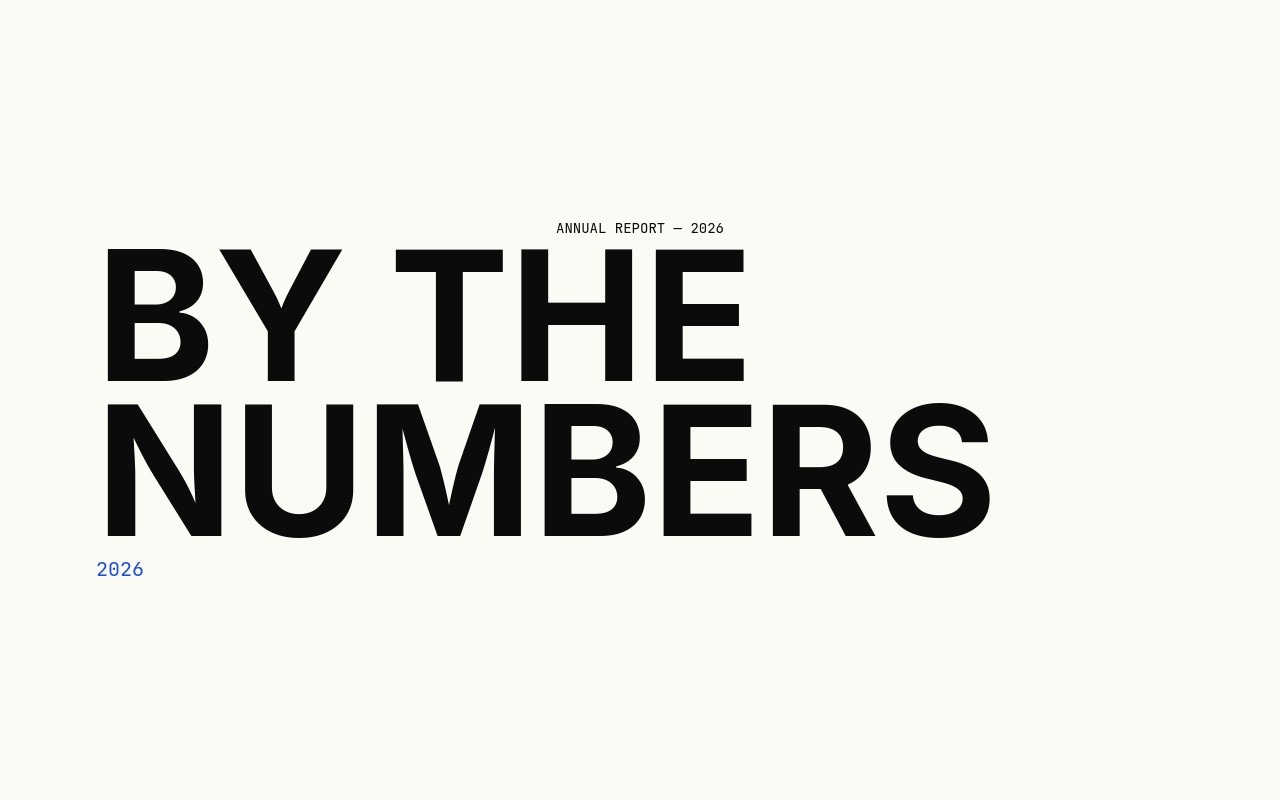
A stat-driven slider with the unmistakable energy of an annual report cover. Seven slides open with a "BY THE NUMBERS / 2026" title card, then walk through five oversized statistics - 94%, 12,847, 3.2s, 0, 47 - each one filling the lower-left of its slide in Inter 900 at 440px on desktop, with a JetBrains Mono label underneath. A small mono category tag sits in the top-left of every stat slide, and the closing "Start counting" CTA wraps the loop. The number-roll animation cycles the digits up to their final value as each slide becomes active, so the slider plays like a counter ticking through milestones.
The palette is tight on purpose - off-white paper, ink black, and a single electric blue accent that lands on the "0 lines of code required" punchline and the year tag on the cover. The slide transition is a sharp 500ms cut with no parallax, which lets the type and the number-roll do the work. Rewrite the stats for your own annual report, year-in-review, investor deck, or growth dashboard, and the structure carries the message without any extra design effort.
#What Makes This Template Stand Out
Number-Roll Animation on Every Stat
Each numeric headline cycles up from zero and locks onto its final value as the slide becomes active. 94%, 12,847, 3.2s - every digit ticks through, so visitors experience the stat being counted rather than just shown. It is the single move that turns a static figure slide into a moment.
Inter 900 at Real Display Scale
Numerals hit 440px on desktop and stay anchored to the lower-left of the slide, with category labels at the top-left and captions underneath the digits. The composition is asymmetric on purpose - the empty space above the numbers is what makes the figure feel monumental.
JetBrains Mono for Annual-Report Texture
Every label, caption, and category tag runs in JetBrains Mono - the small "01 / CUSTOMER SUCCESS" markers, the "of customers ship faster" captions, the "END / 2026" sign-off. The mono spacing gives the stats the texture of a real financial document without feeling cold.
One Electric Blue Punchline
The palette stays in paper and ink for six slides, then the "0 lines of code required" stat wears electric blue to land the rhetorical move. Move the accent to whichever number carries your strongest message and the rhythm holds. Restraint is what makes the color read.
Cover and Closer That Frame the Sequence
The opening "BY THE NUMBERS / 2026" title card and the closing "Start counting" CTA give the stats a beginning and an end, the way a real annual report does. The closer wraps the loop with a button block you can route to a sign-up, a contact form, or a download link.
#Who Should Use This Template
SaaS and product teams publishing annual reports, year-in-review pages, or growth recaps will get the most out of this template. Drop in real metrics - customers shipped, projects launched, time saved, code lines avoided - and the number-roll animation turns the dashboard into a story. Replace the five built-in stats with your own and the structure carries the entire end-of-year narrative.
Investor decks, fundraising pages, and pitch microsites can use this as the traction slide reel. The asymmetric Inter 900 numerals communicate growth in a way that no chart can match, and the JetBrains Mono category tags ("CUSTOMER SUCCESS", "GROWTH", "SIMPLICITY") read like the section markers in a real financial document. Swap the numbers, point the closing CTA at your data room, and ship.
Marketing teams and growth analysts running campaign recaps, quarterly milestones, or "by the numbers" landing sections can plug this template in as a focused stat-driven block on a longer page. The pure-type approach means no charts, no illustrations, no photography - just numbers, labels, and the count-up animation doing the storytelling.
#Best Use Cases
- ✓SaaS annual reports and year-in-review landing pages
- ✓Investor decks and fundraising microsite traction slides
- ✓Growth dashboards and quarterly milestone announcements
- ✓Product launch metric reels showing customer adoption numbers
- ✓Conference and event recap pages with attendance and outcome stats
- ✓Nonprofit and impact-report landing pages with mission-critical figures
- ✓Hiring page sections showing team growth, customers served, or markets entered
- ✓Pricing and plan pages with stat-driven proof points above the tiers
#How to Customize
- Open the Numbers template in Swiper Studio. You will see seven slides: a "BY THE NUMBERS / 2026" cover, five stat slides, and a "Start counting" CTA closer.1
- Update the cover title and year to match your report. The "ANNUAL REPORT - 2026" mono tag at the top can be retitled for quarterly, monthly, or campaign-specific reports.2
- Replace each stat with your own number. Click into the Inter 900 figure on any stat slide, retype the value, and the number-roll animation picks up the new final number automatically.3
- Rewrite the JetBrains Mono caption underneath each number to describe what the stat measures. Keep the captions short - one line, sentence case, in mono - so they read as data labels rather than marketing copy.4
- Update the "01 / CUSTOMER SUCCESS" category tags in the top-left of each stat slide. Use them as section markers - GROWTH, REVENUE, RETENTION, EFFICIENCY - to give the deck shape.5
- Move the electric blue accent to whichever stat carries your strongest punchline. The default lands on slide 5; reassign the blue hex to a different numeric headline and reset slide 5 to ink black.6
- Retarget the "Start counting" link on the closing slide to your sign-up form, data room, or contact page. The mono button block accepts any href and target.7
- Publish to CDN for an instant embed in a blog post or annual-report page, or export to React, Vue, HTML, or Webflow if you want to ship the stat reel inside a larger product or investor site.8
#Frequently Asked Questions
- How does the number-roll animation work and is it editable?
- Each numeric headline uses Swiper Studio's built-in number-roll entry animation - digits cycle up from zero and lock onto the final value as the slide becomes active. The duration and stagger are set per child, so you can speed up the count, slow it down for ceremonial pacing, or trigger label fades after the roll completes.
- Can I change the stats and category labels to my own numbers?
- Yes. Every figure - 94%, 12,847, 3.2s, 0, 47 - is plain Inter text, and every label like "of customers ship faster" or "lines of code required" is plain JetBrains Mono. Click in, retype, and the number-roll picks up the new final value automatically. The "01 / CUSTOMER SUCCESS" category labels are the same.
- Why are some numbers blue and most black?
- The default rule is one electric blue stat per sequence - on the built-in build, the "0" on slide 5 ("lines of code required") wears the accent to mark the punchline. Use the blue sparingly. Move it to whichever stat carries the strongest message in your own deck and the rhythm holds.
- Will the 440px numerals stay readable on phones?
- Yes. The numeric scale is registered at three breakpoints - around 160px on phone, 260px on tablet, and 360 to 440px on desktop. The number-roll animation rescales with the type, so the digits cycle smoothly at every size without overflow.
- What fonts does the template use and do they ship with exports?
- Inter at weight 900 carries every numeric headline and the cover title "BY THE NUMBERS". JetBrains Mono runs the category labels, the small bottom captions, and the closing "Start counting" link. Both load automatically inside Swiper Studio and are bundled into HTML, React, Vue, and Webflow exports.
#Related Templates


#Related Resources
- Swiper Studio for Landing Pages
- Swiper Studio for Marketers
- Swiper Studio for Developers
- Swiper Studio for Small Businesses
Ready to Build Your Slider?
Pick a template, customize it visually, and export production-ready code to React, Vue, Next.js, HTML, Webflow, and more. No coding required.